Maps & Geospatial
Digital maps are interactive representations of geographic areas and points. In Brickgraph, maps provide a visual foundation for displaying your business data in its geographic context.
Geospatial Analytics
Geospatial analytics is the process of gathering, displaying, and analyzing data related to geographic locations. This helps you answer questions like:
- Where are your customers concentrated?
- Which service territories are most profitable?
- How efficiently are your delivery routes organized?
- What patterns emerge when business data is viewed geographically?
Map Layers
Map layers are stackable visual elements that can be turned on or off to display different types of information:
- Base layers - The underlying map (street view, satellite imagery, terrain)
- Graph Data - Your business data derived from the Brickgraph graph that you create and maintain
- Radius - Travel-time areas visualised alongside data (demographics, economics, census indicators, etc.)
- Datasets - Contextual information (administrative boundaries, zip codes, neighborhoods, flood zones, etc.)
Map Projections
Map projections are methods of representing the curved surface of the Earth on a flat screen. Different projections serve different purposes:
- Mercator - Preserves shape but distorts size (especially near poles)
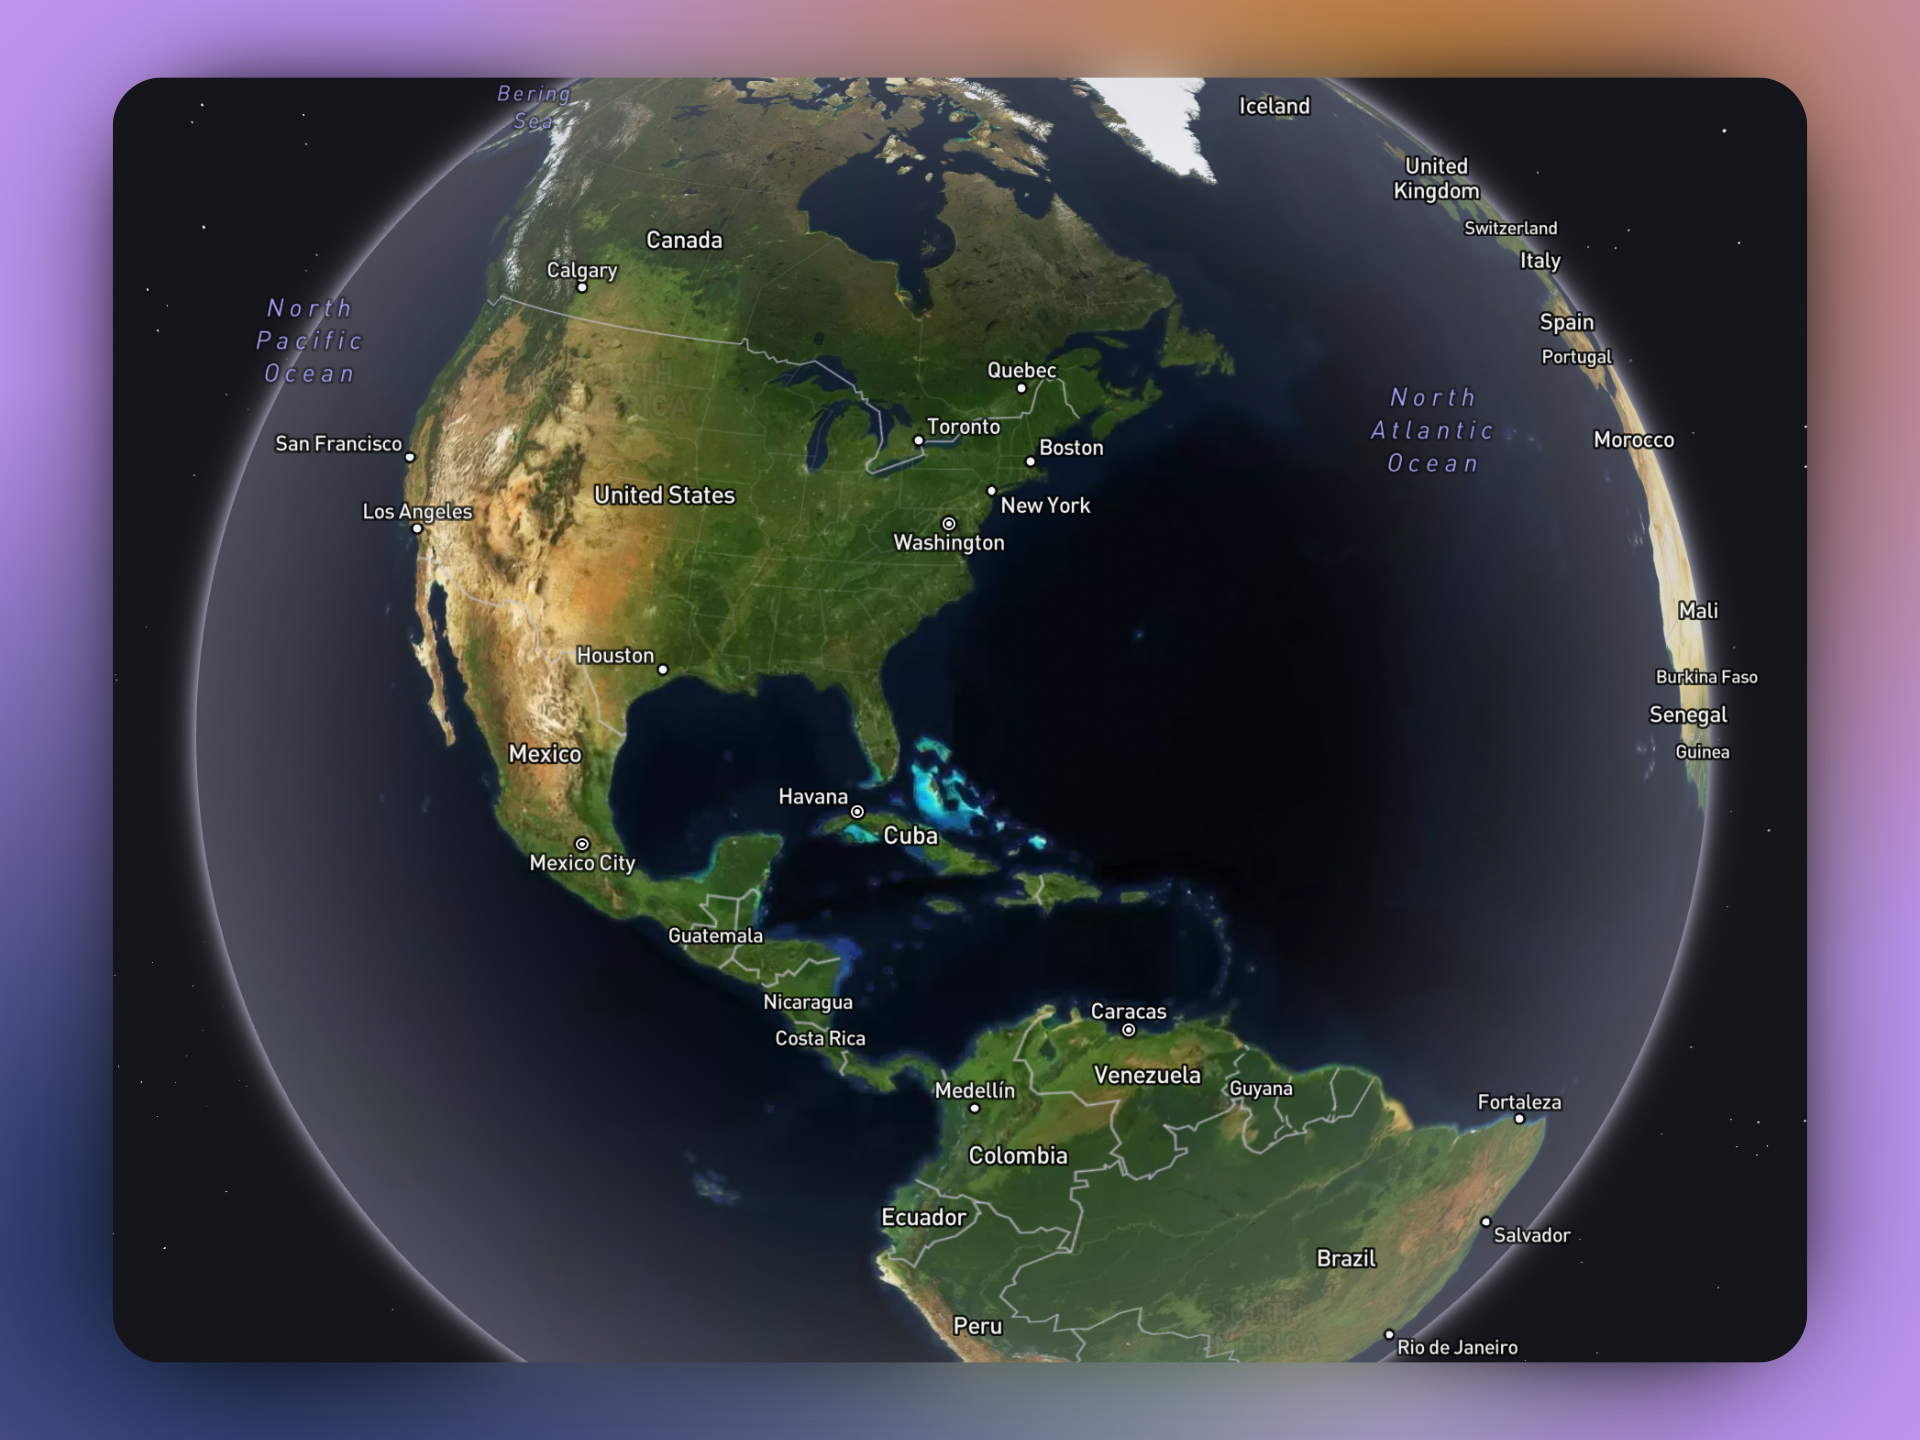
- Globe - Maintains proportions of the actual globe in three dimensions
Brickgraph map settings allow you to toggle between the two types.
Geocoding
Converting addresses or place names into map coordinates (latitude/longitude). This allows you to place your business data accurately on maps. Geocoding can also be done in reverse - which is the process of converting a latitude/longitude point to an associated address (right-clicking on the Brickgraph map is an example of this in action.)
Radius Buffers & Proximity
Creating zones around points or areas to analyze nearby features. Examples include:
- 5-mile radius around each store location
- Areas within a 30-minute drive time
- Overlap between delivery zones
Examples and Use Cases
- Visualize network connections with geographic context
- Discover spatial patterns that might be missed in tables or charts
- Filter and analyze data based on location
- Make decisions informed by geographic relationships
- Create compelling visual stories about their business data