Knowledge Graphs
What is a knowledge graph?
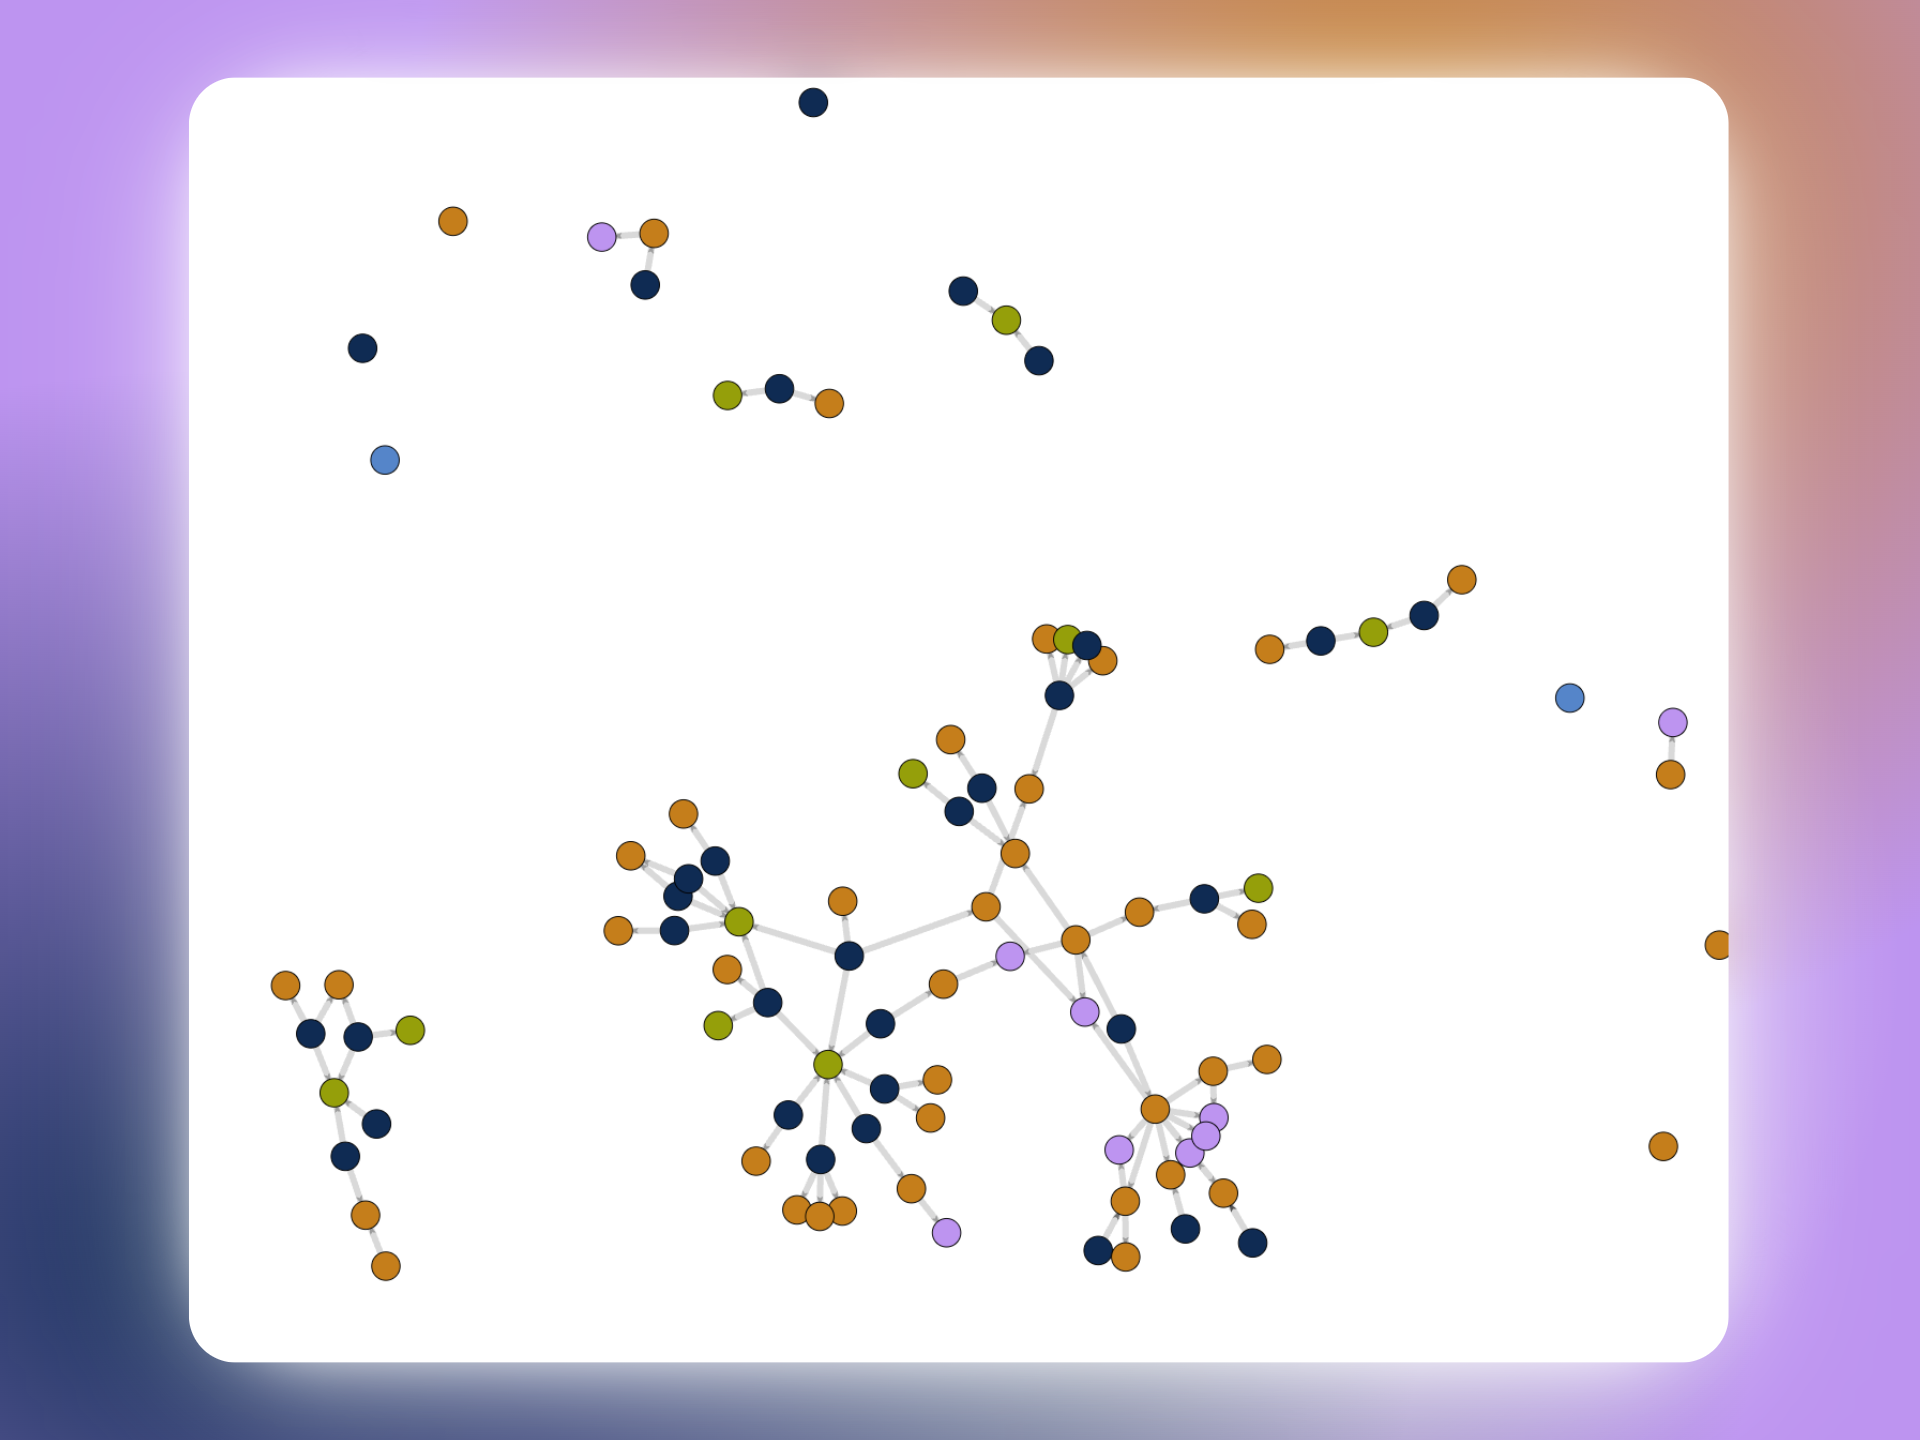
A knowledge graph is a way of organizing information that shows how different pieces of data connect to each other. Unlike traditional databases that store information in tables or lists, knowledge graphs represent information as a network of interconnected concepts.
How they work
Think of a knowledge graph like a map of your business knowledge. There are three main components to a knowledge graph:
- Entities represent things (like customers, products, locations, or events). Sometimes called Nodes or Vertices.
- Relationships show how these things relate to each other (like "customer purchased product" or "location contains inventory"). Sometimes called Edges or Connections.
- Fields are properties that can be assigned to either Entities or Relationships. They can be formatted as text, numbers, dates, addresses, and more. Sometimes called Properties or Attributes
With a knowledge graph data model made up of Entities and Relationships (that each have respective Fields) nearly any model - or map, if you like - can be designed and developed.
Examples
Your knowledge graph might connect a customer to their purchase history, which connects to products, which connect to suppliers, which connect to locations—all creating a rich web of business relationships.
The power of knowledge graphs comes from their ability to:
- Reveal hidden connections between different parts of your business
- Answer complex questions that span multiple areas of your organization
- Provide context by showing how information is related
- Adapt easily as your business and data needs change
With Brickgraph, you'll be able to visualize these connections, discover new insights, and make better decisions based on a complete picture of your business data.
Some famous examples of knowledge graphs that you may have encountered or heard about are from Google, Amazon, and NASA.
Learn More
Interested in a deep dive? More about knowledge graphs available here.