Map Layers
Brickgraph enables you to integrate different data onto the map for visualization and analysis. These include your own data from the Brickgraph Knowledge Graph alongside external datasets for demographics, boundaries, and more. These can be accessed from the menu at the top left corner of the map.
Currently there are three types of layers;
Graph Data
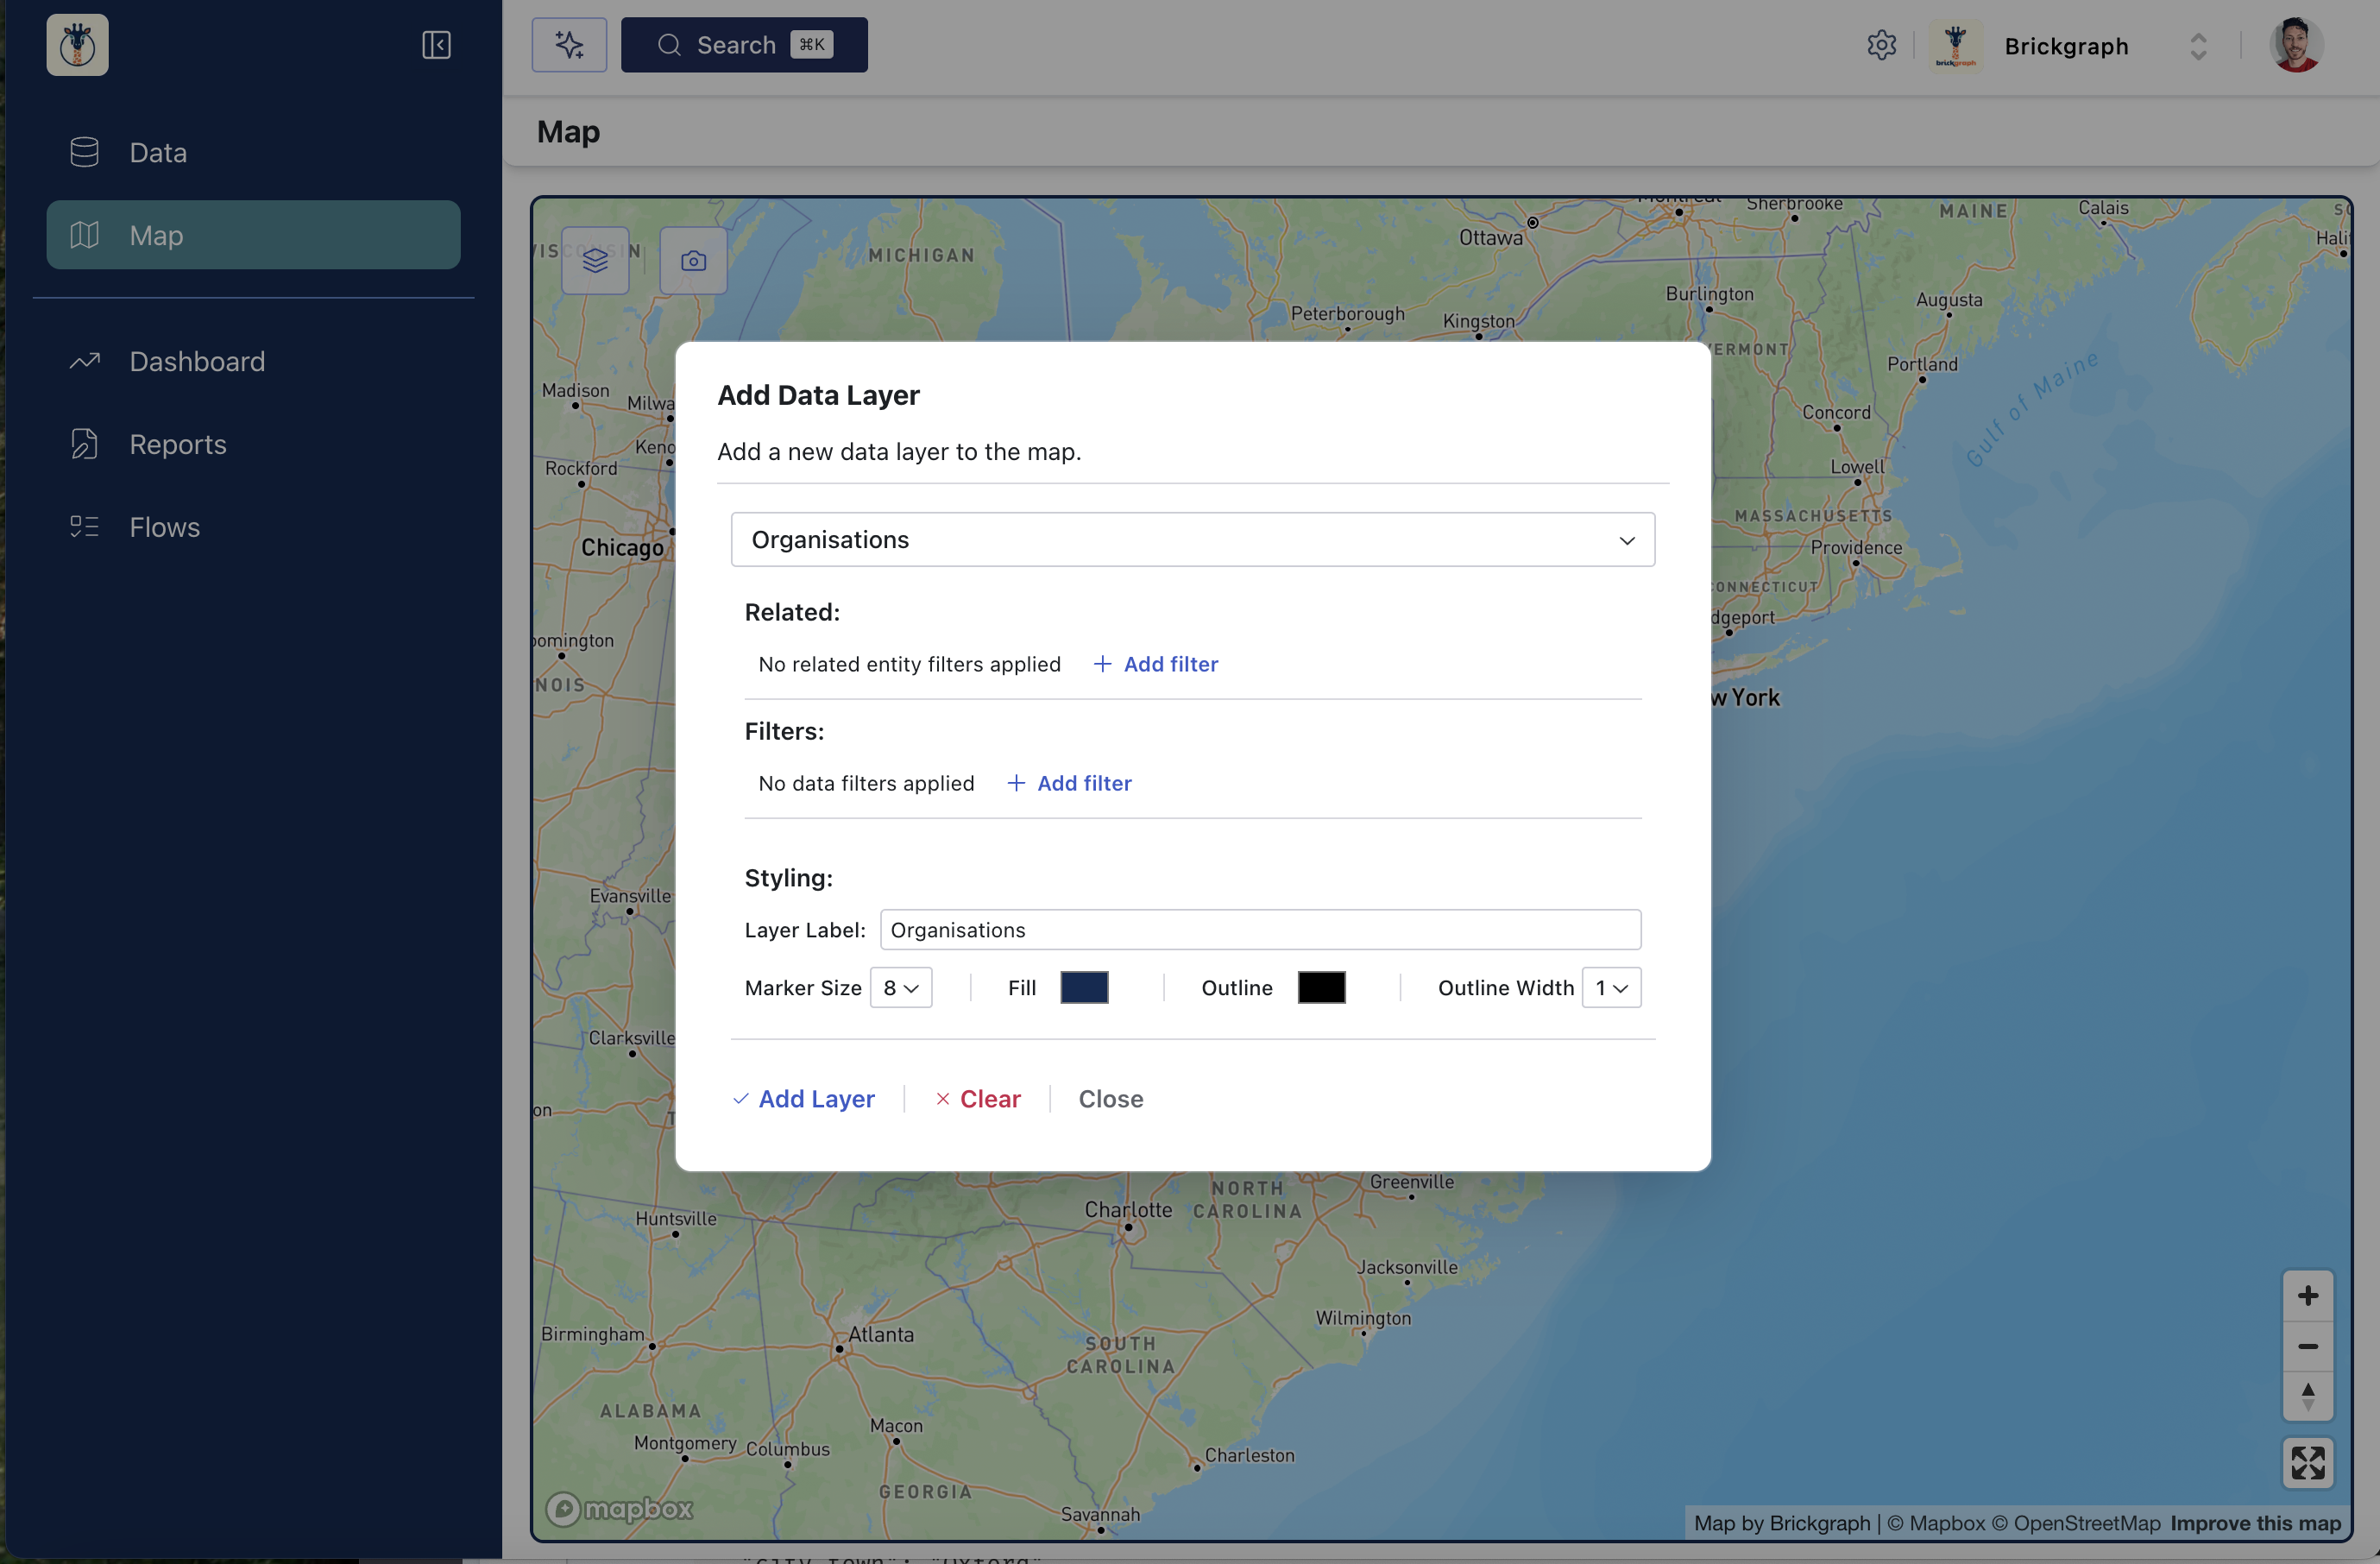
You can add data from your knowledge graph by selecting "Graph Data" from the "Add Layer" option. When clicked the Graph Data dialog will appear, which allows you to select the data, filters, and styling options. The only entity options for Graph Data will be those which have an address field in the data model.
Filtering the data works the same as in the Data Editor.
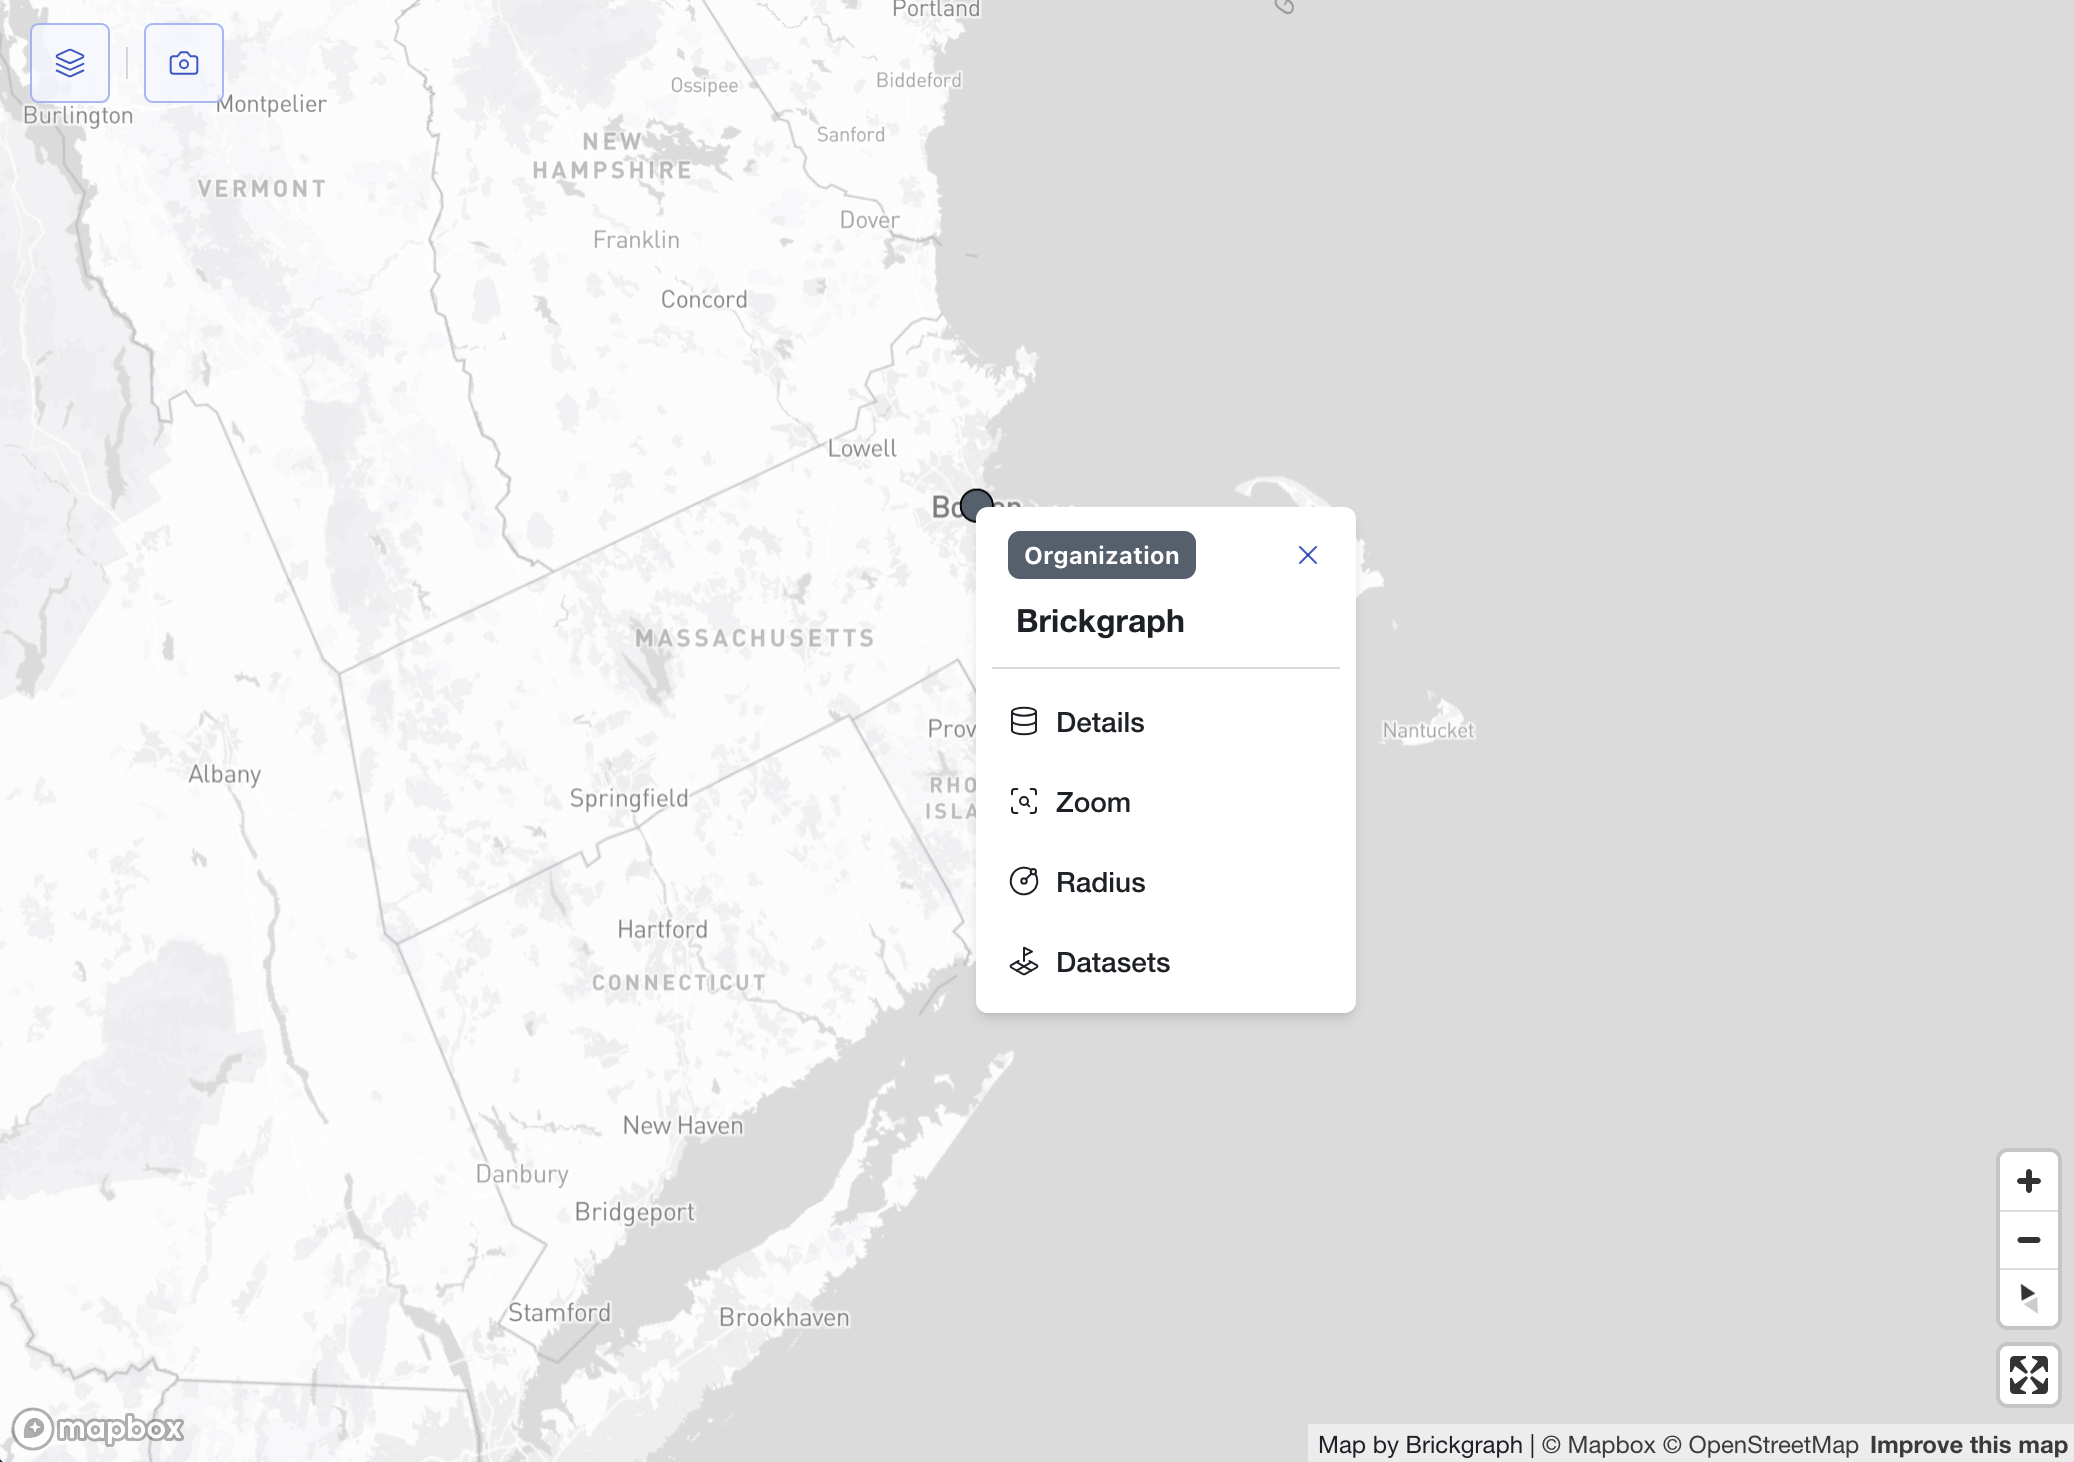
When the points are displayed on the map you can click on any point to open the Analyse Menu. This menu has options to;
- Open a data editor dialog for the selected entity
- Zoom to the location
- Start a pre-populated Radius layer
- Start a pre-populated Datasets layer
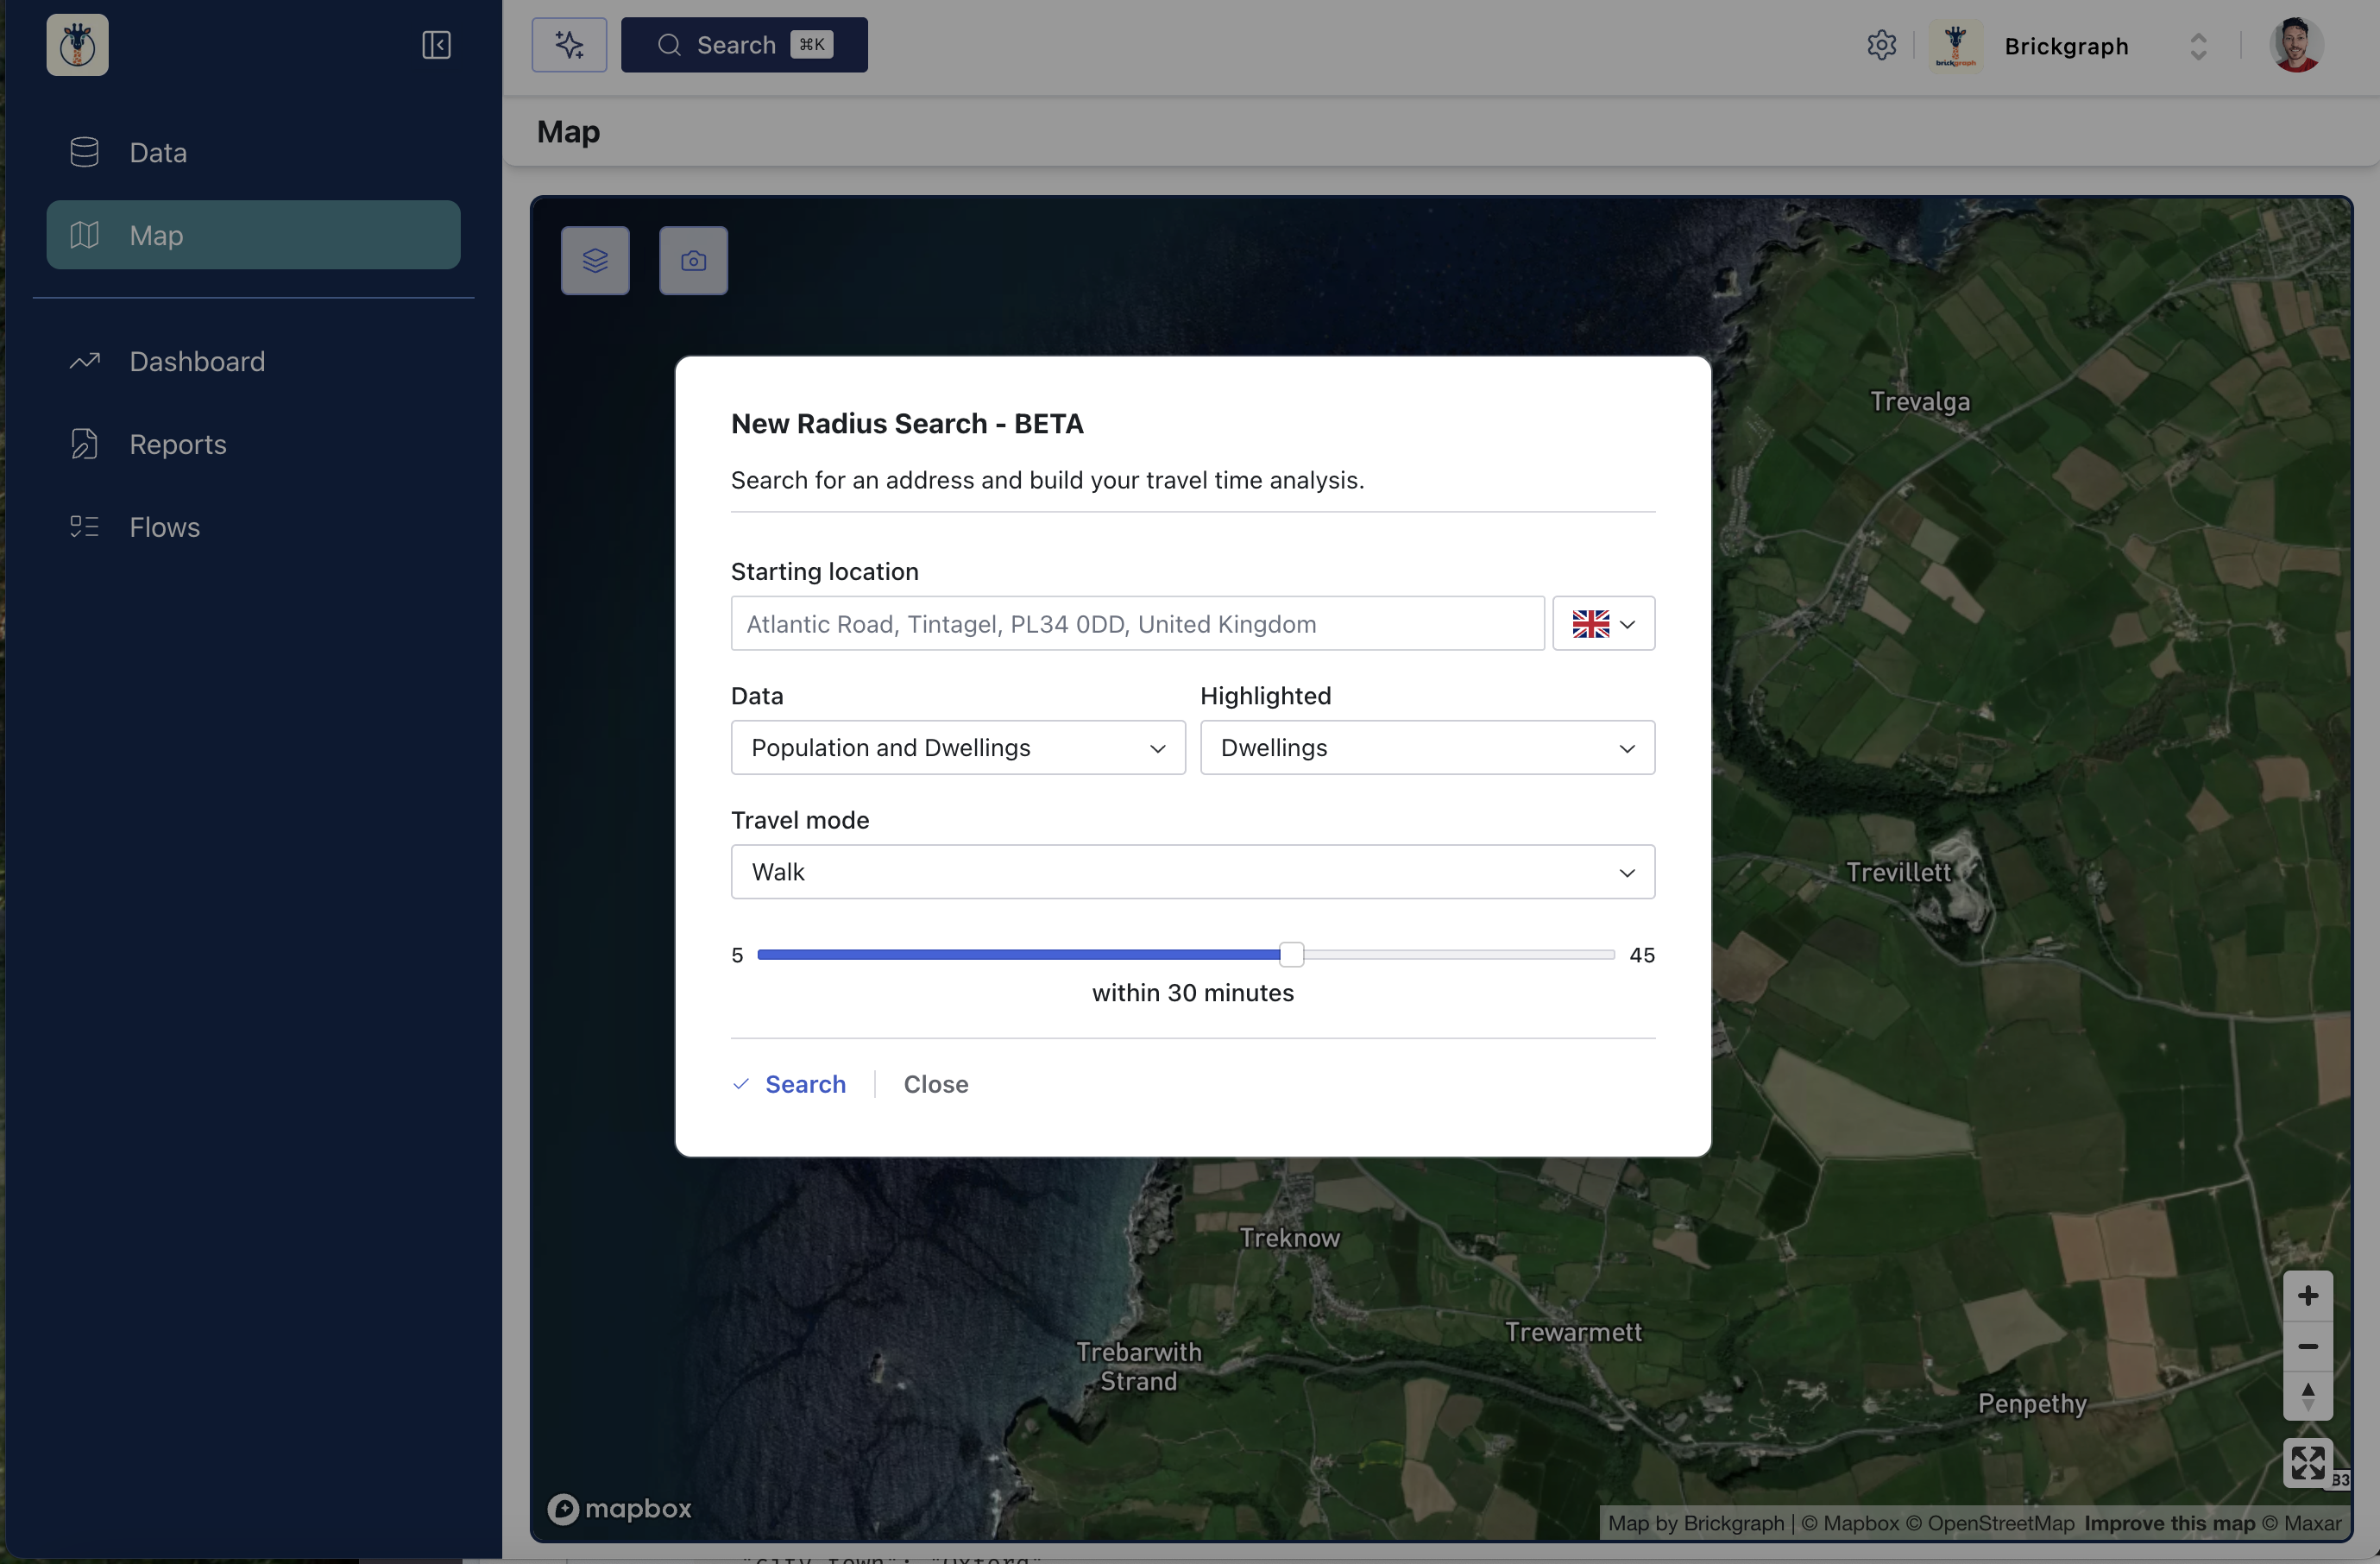
Radius
Radius layers create a travel-time area around the given address / point. You can either search for an address in the search bar or use the pre-populated location - then specify which data category and point you want to view and highlight, respectively. Then edit the travel mode and time and press Search to begin processing.
Once the layer is processed and visible on the map you can select the icon to open a menu with options to view more details about the data. You can also use the layer manager to customize how the Radius layer looks by hiding/showing the marker as well as toggling the heatmap on/off.
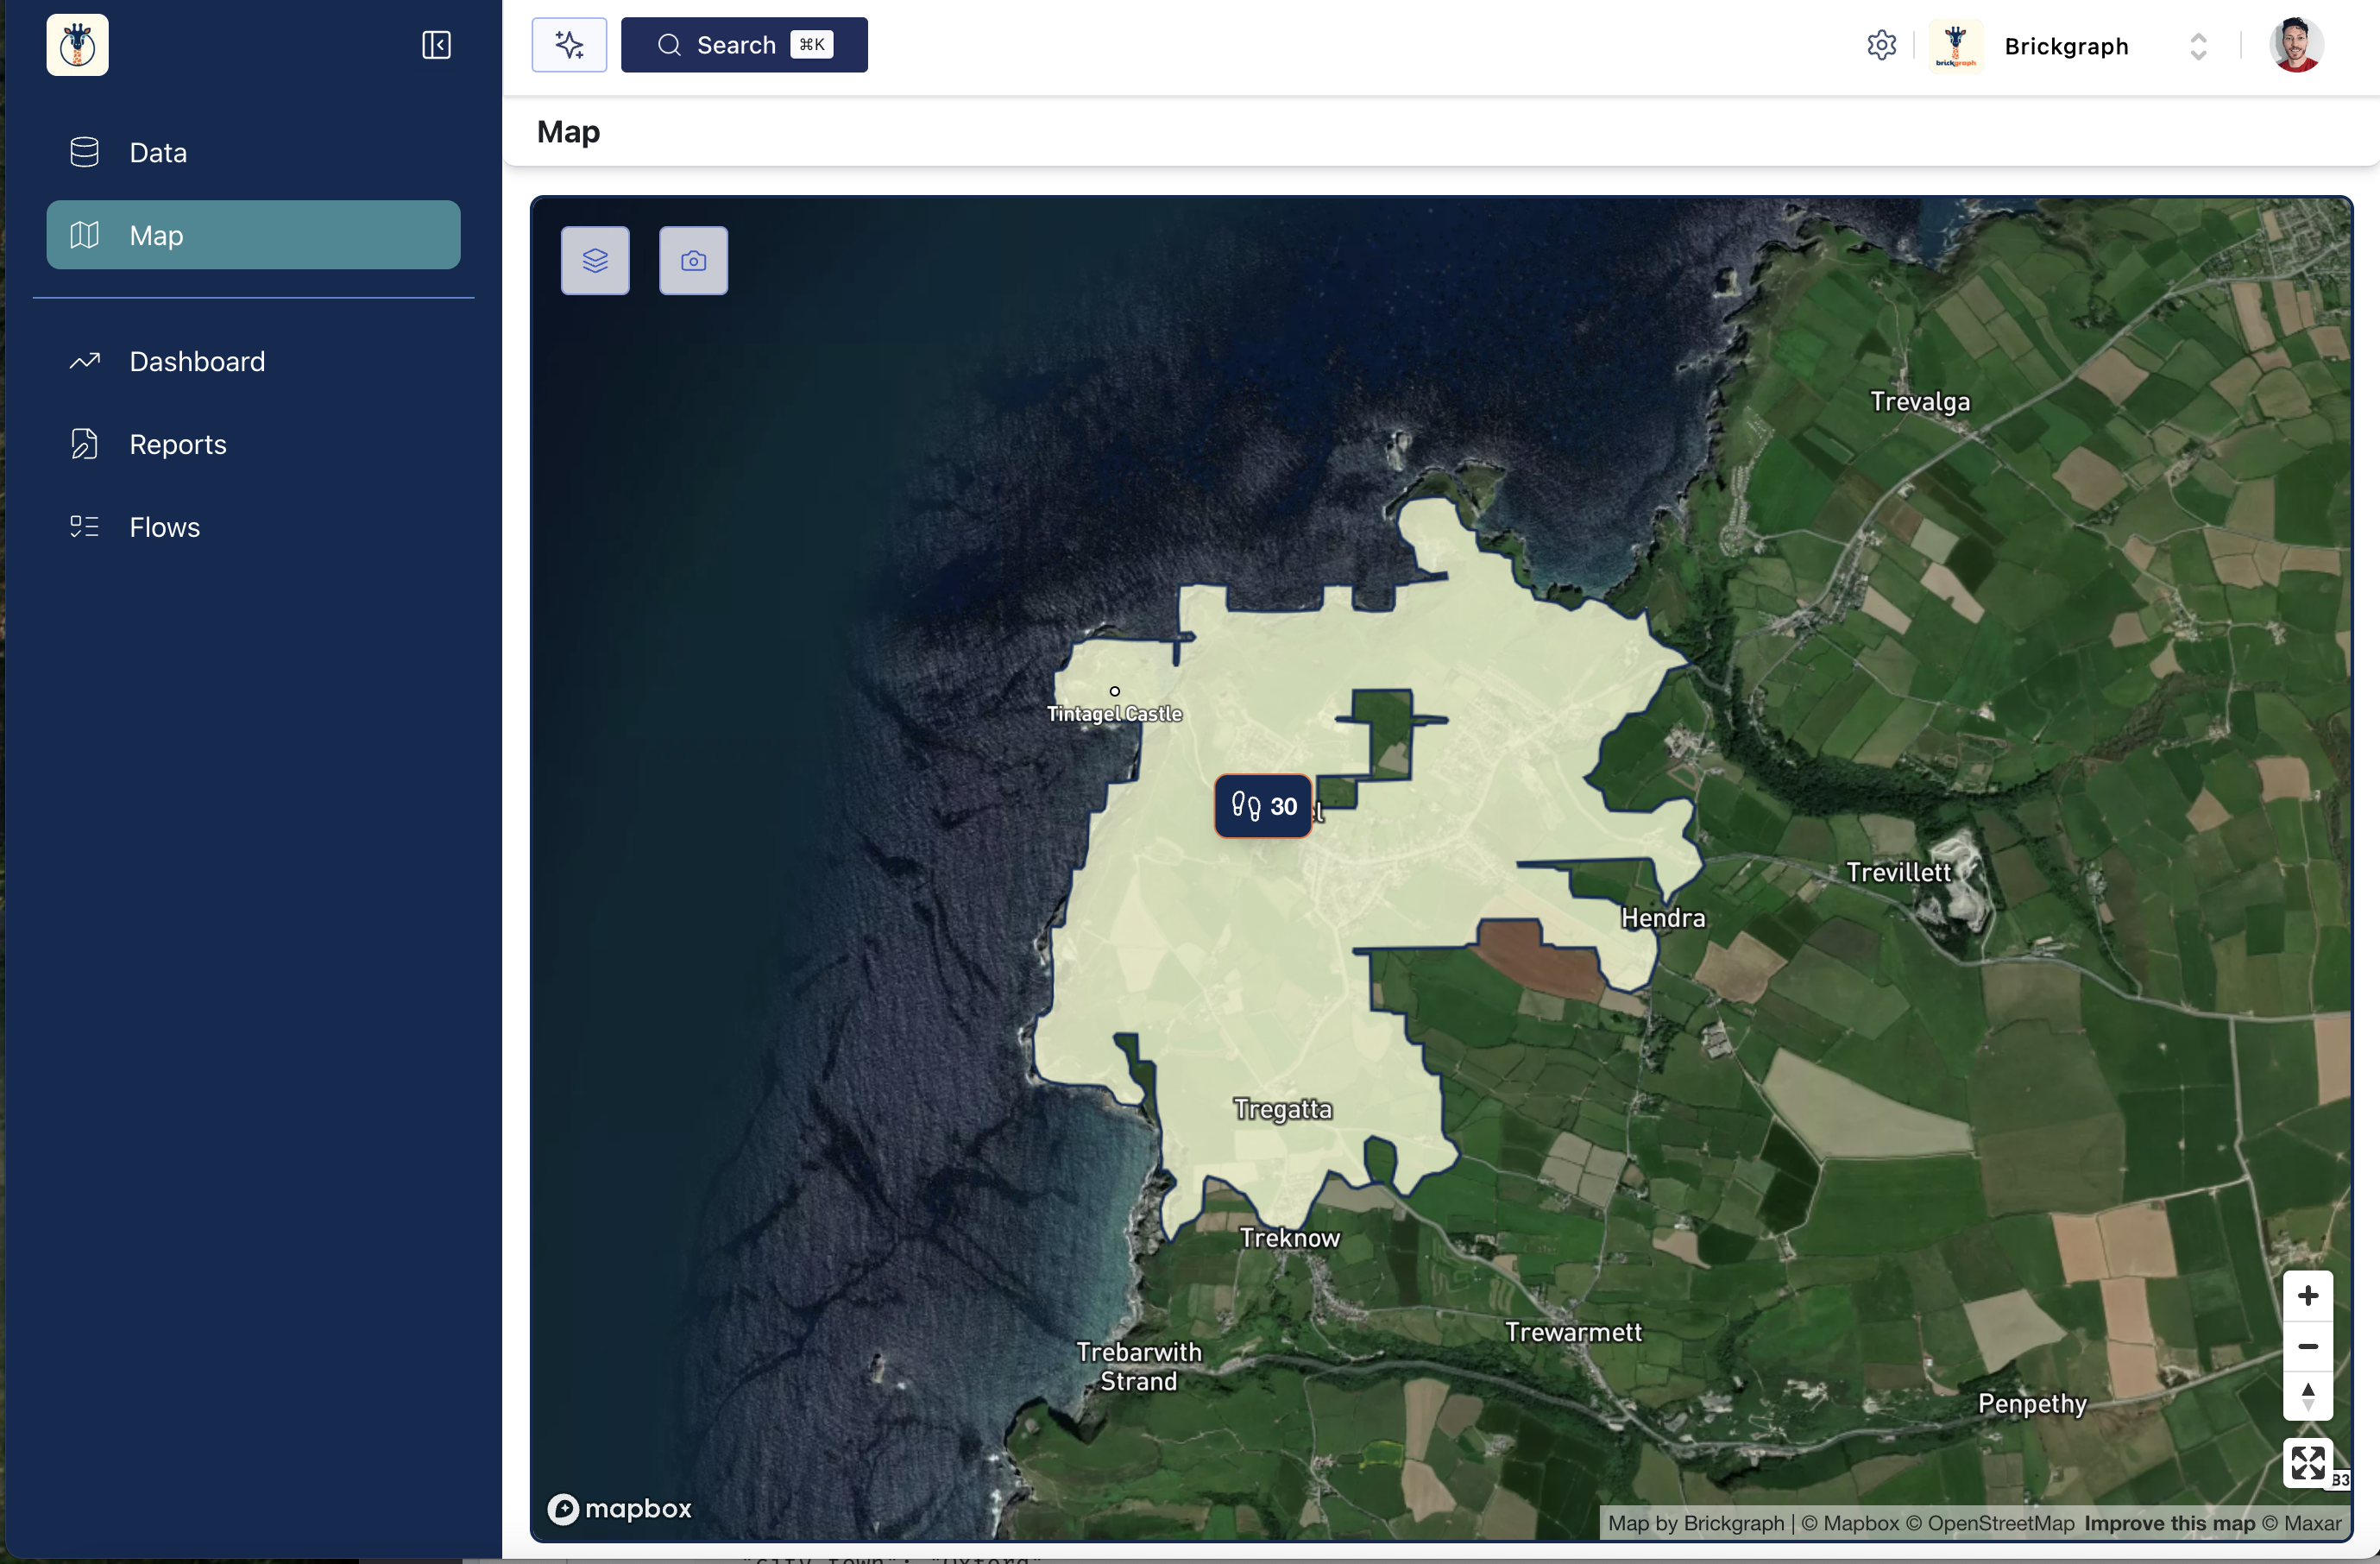
Please keep in mind that Radius data is currently only available for the United Kingdom. All other geographies will return empty data but will visualize the travel time area.
Datasets
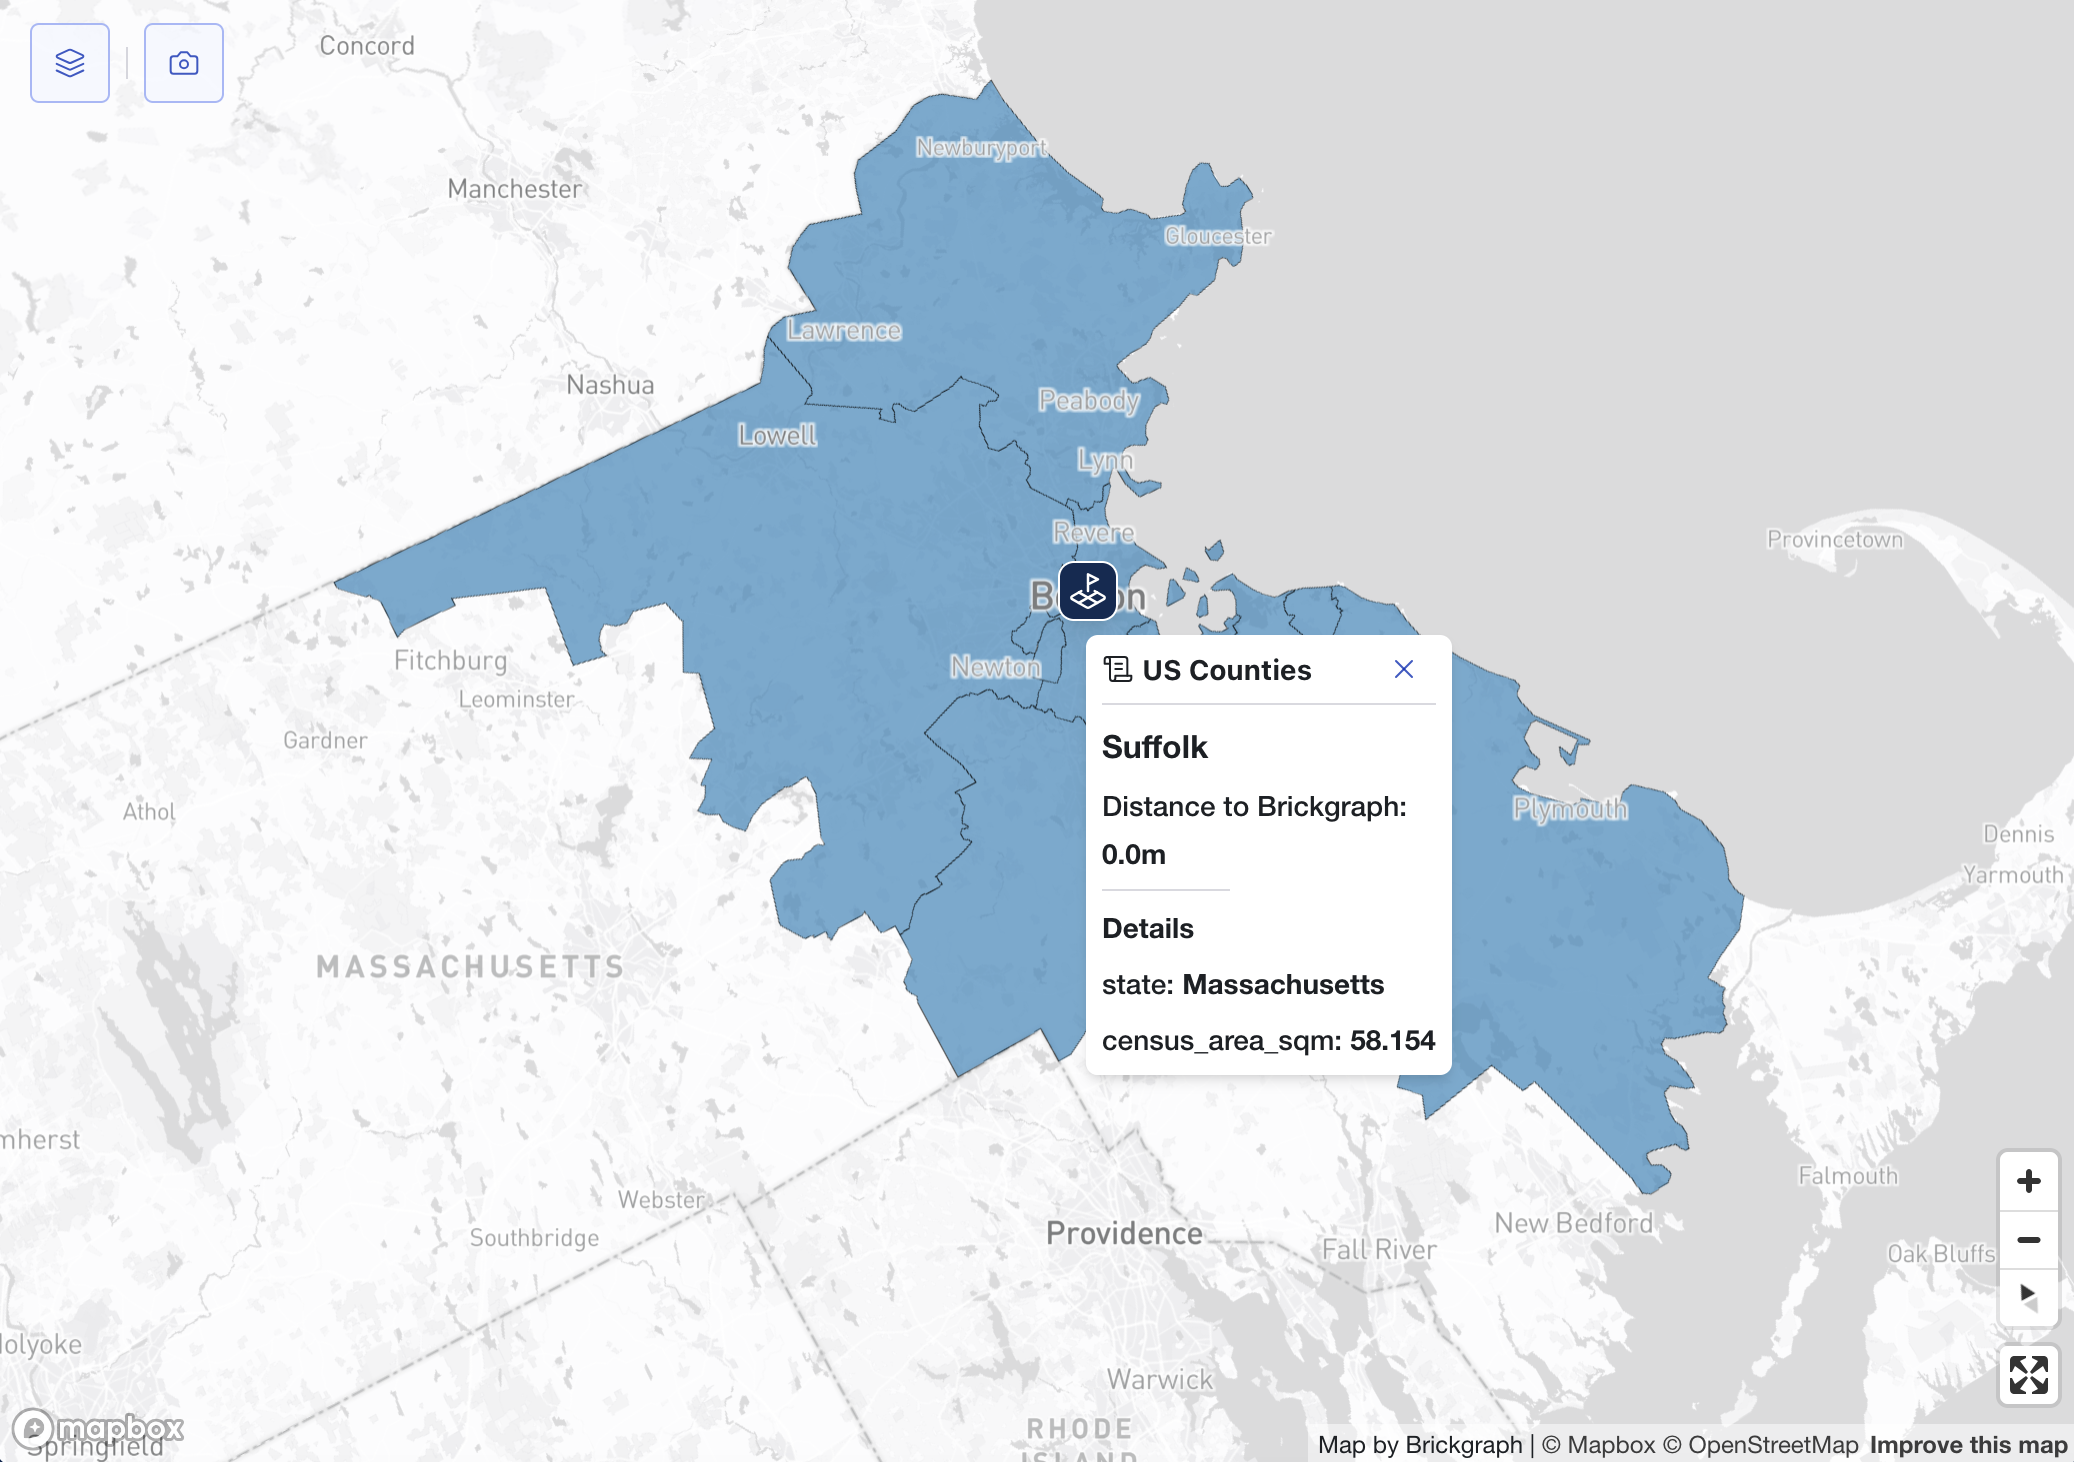
Dataset layers create boundary areas near the selected location. It is as simple as selected the desired data and the number of features to visualise (the max amount varies).
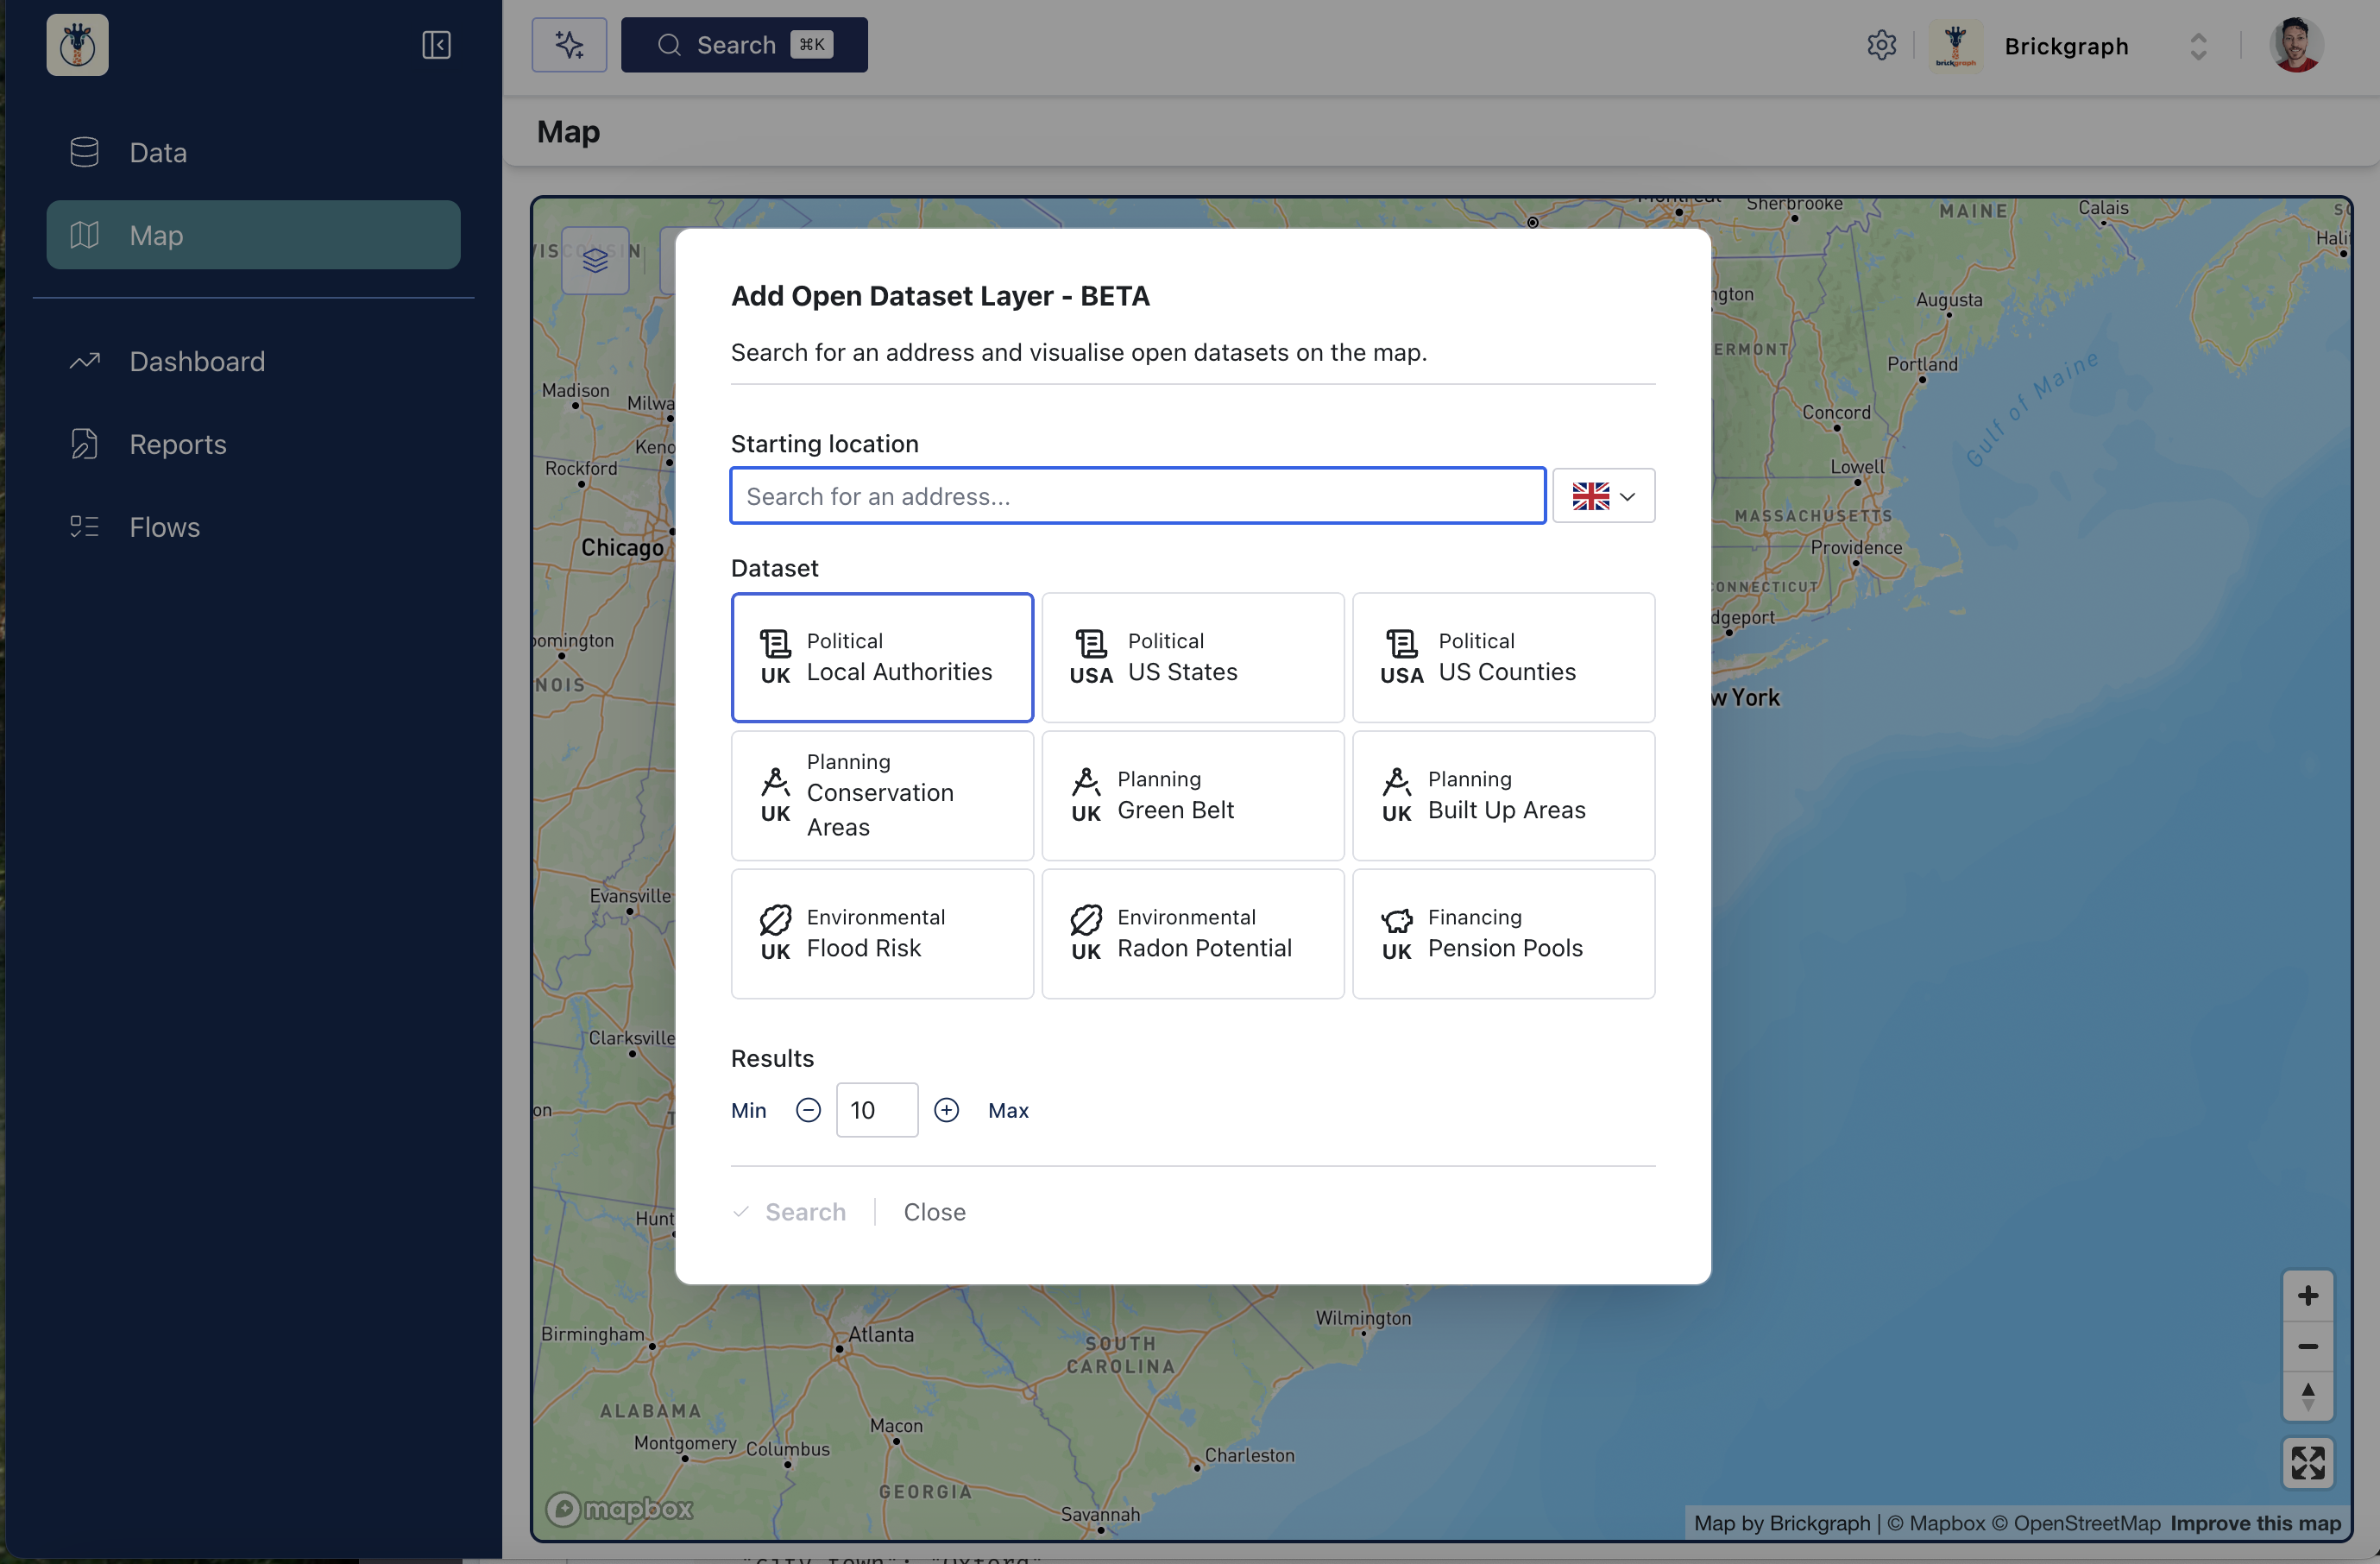
We are continuously adding new datasets, feel free to request new datasets by contacting support@brickgraph.io
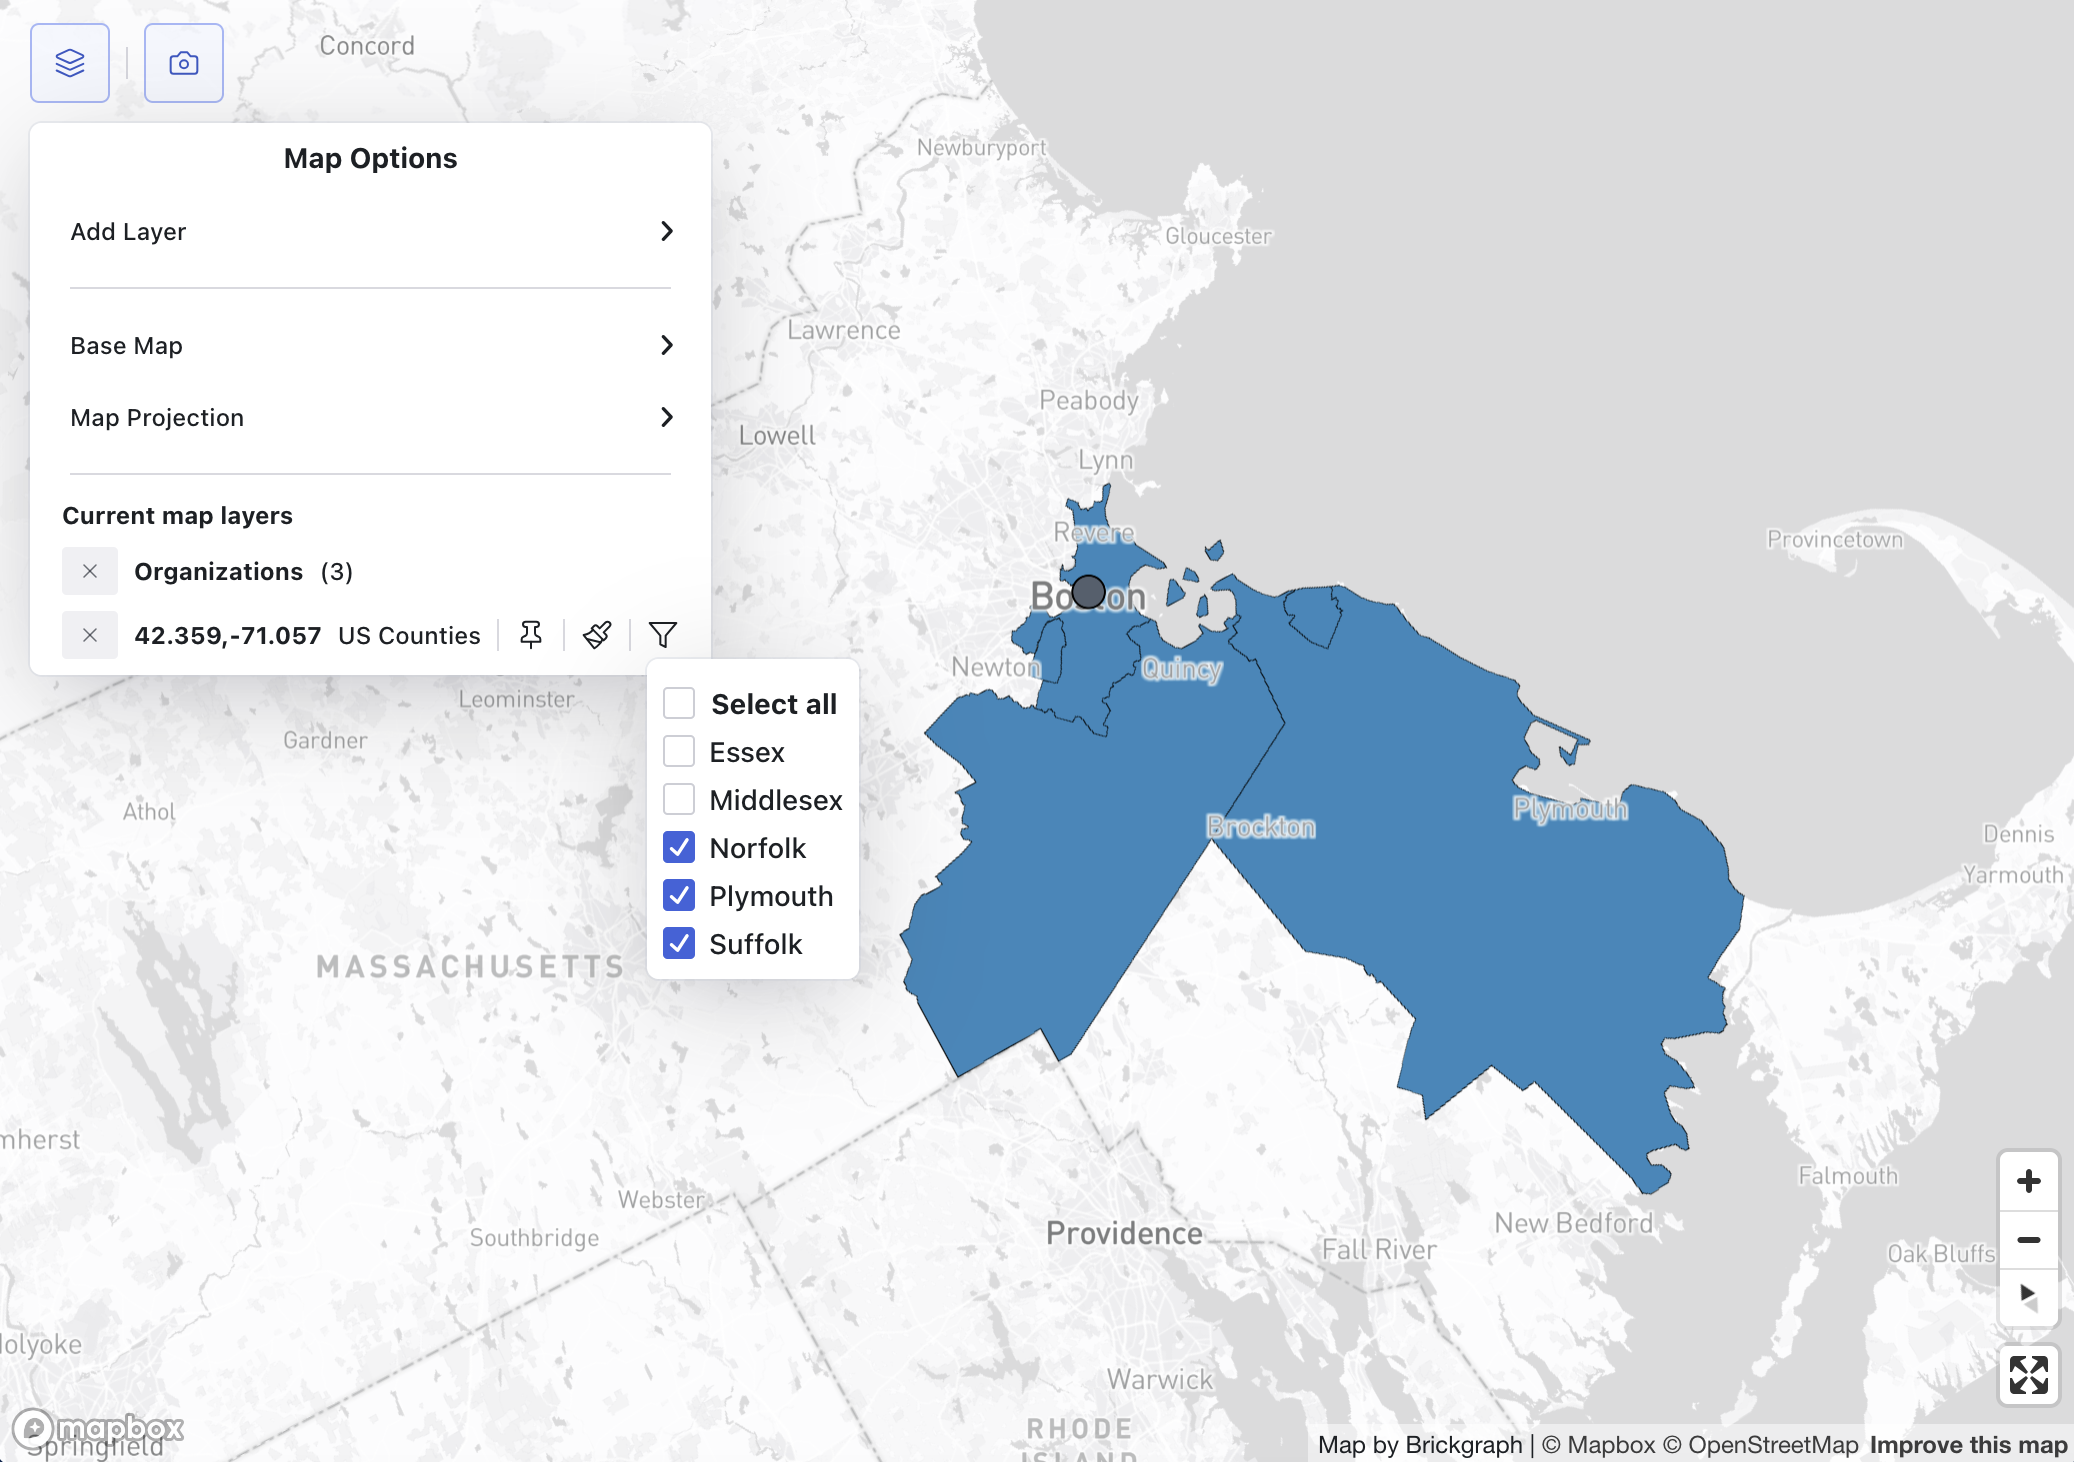
Layer Manager
The menu in the top left corner of the map will list all of the currently applied layers. Depending on the layer type you can apply styling options.
- Radius layers can hide/show marker and/or heatmap data
- Dataset layers can; hide/show the marker; change color settings for the areas; and/or toggle visibility of individual features of the dataset